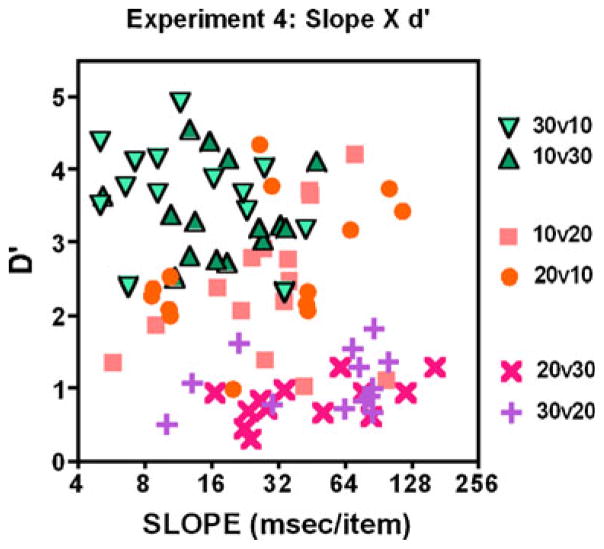
Fig. 6.
Scatterplot of d′ × set size of the reaction time×set size function. Each data point represents the performance of one observer in one condition. The d′ values are based on corrected false alarm rates. If there were no false alarms for one observer in one condition, 0.5 false alarms were added. Slopes are plotted on a log axis only for convenience. One data point in the 30:10 condition is missing (slope = 0.8, d′ = 2.8)

