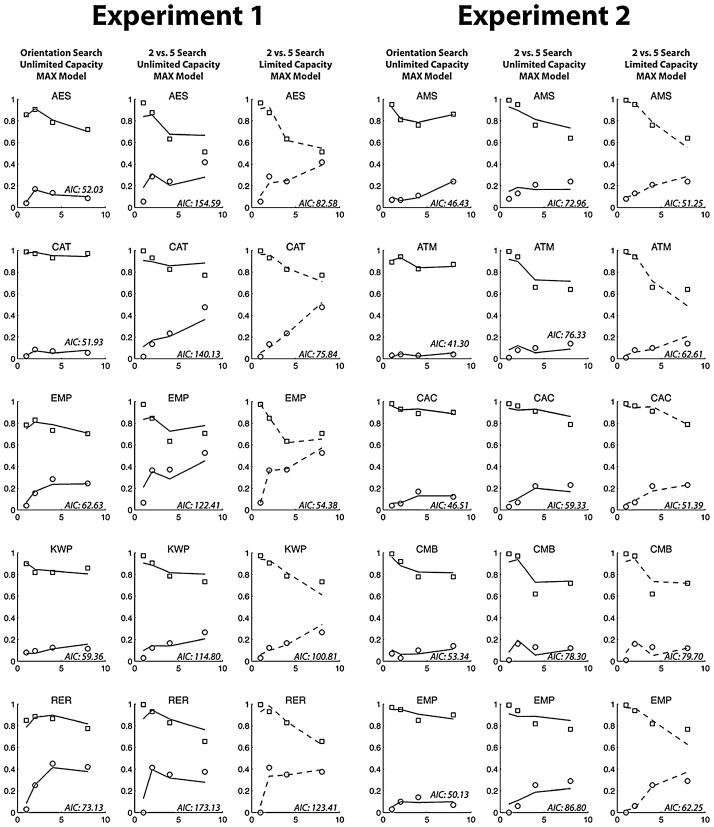
Fig. 6.
Hit rates (squares) and false alarm rates (circles) for Experiments 1 and 2 for all observers. For each experiment, the left column of graphs shows data for orientation feature search, which is well fit by the UNLIMITED-CAPACITY MAX model (solid lines). The middle column shows data from the spatial configuration “2” versus “5” experiment, UNLIMITED-CAPACITY MAX model fits. The right column shows the same “2” versus “5” data, but fit with a LIMITED-CAPACITY MAX model (dashed lines). The Akaike information criterion (AIC) for each graph is reported in the lower right. Lower AIC scores indicate a better fit of the model to the data. For 9 of the 10 observers, the LIMITED-CAPACITY model fit the “2” versus “5” data better than the UNLIMITED-CAPACITY MAX model

