
Figure 1.
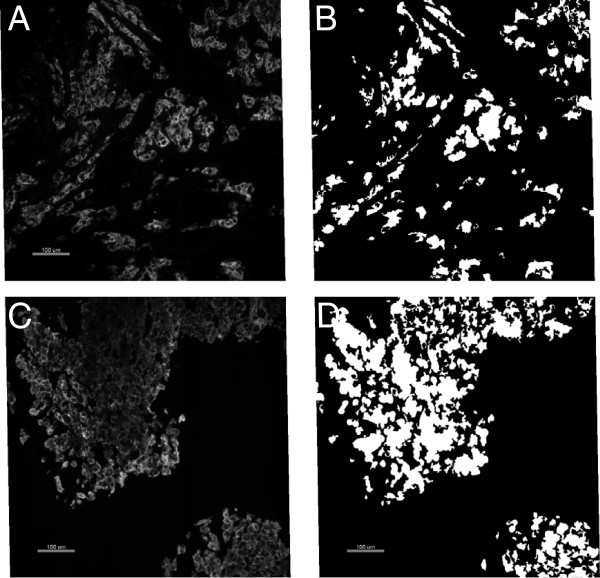
HER2 and pHER2 staining. A: A representative image of HER2 expression visualized with CB11 antibody; B: Tumor area defined by cytokeratin expression for image A; C: phopho HER2 (pY1248) expression visualized with the PN2A antibody; D: Tumor area defined by cytokeratin for image C.