
Figure 3.
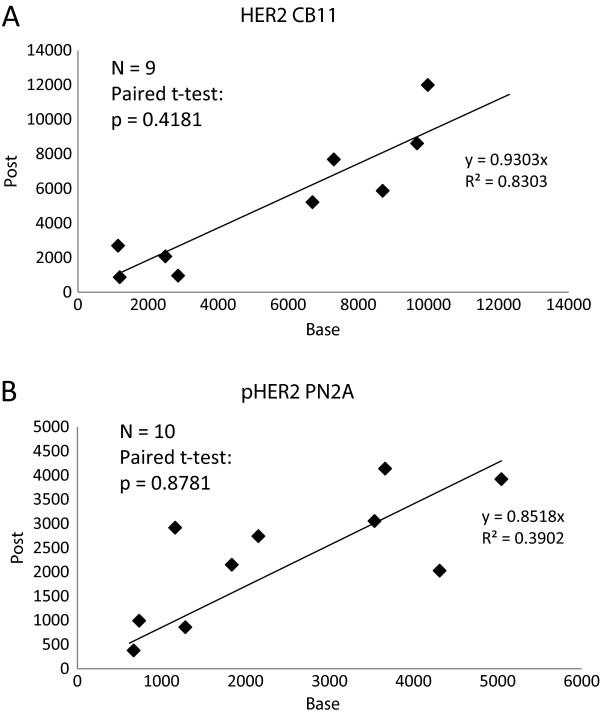
Biomarker change with one dose of trastuzumab. A: HER2 expression level change before (base) and after (post) one dose of trastuzumab shown in AQUA scores; B: phospho HER2 expression level change before (base) and after (post) one dose of trastuzumab shown in AQUA scores.