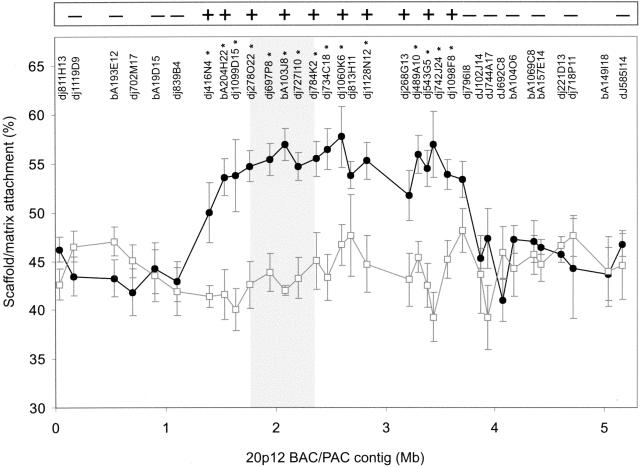
Figure 1.
Determination of Scaffold/matrix attachment along the 20p12 BAC/PAC contig using the SIA procedure. Percent matrix/scaffold attachment as determined by array analysis is plotted against BAC/PAC position along the contig for cell lines containing the invdup(20p) chromosome (circles) or normal chromosomes only (squares). Data-points represent the mean ± one standard deviation from at least six independent experiments. The names of the different BAC/PACs are indicated at the top of the graph. BAC/PACs showing a significantly increased scaffold/matrix attachment on the invdup(20p) neocentromere (P <0.05) over the corresponding non-neocentromeric 20p12 region are indicated by asterisks. The shaded area indicates the previously identified CENP-A-binding region. The inset box at the top of the graph represents a summary of the FISH analysis of metaphase chromosomes for a number of the BAC/PACs probes used in the array hybridization analysis, in which - and + denote no difference and an increase in scaffold/matrix attachment, respectively.

