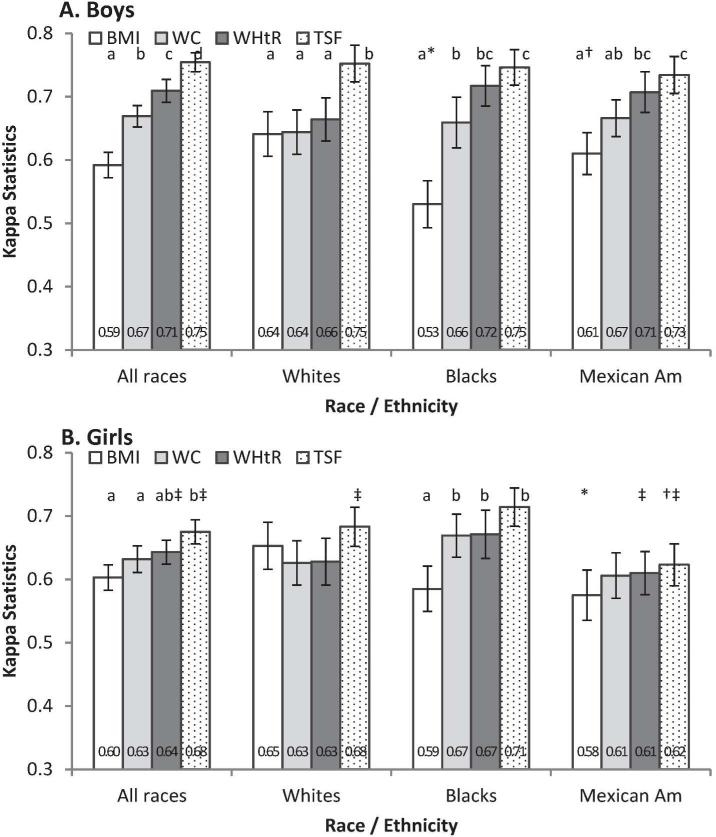
FIGURE 2.
Weighted kappa (95% CI) for the agreement between quartiles of percentage body fat (%BF) and anthropometric measures. BMI, body mass index; TSF, triceps skinfold thickness; WC, waist circumference; WHtR, waist-to-height ratio. * Differed from whites within sex; † differed from blacks within sex; ‡ differed from boys within race-ethnicity (P < 0.05; t-test).a,b,c Values in a subgroup (e.g., by sex and racial-ethnic group) with different superscript letters were significantly different (P < 0.05; t-test) ; a group without the letters indicates no difference (P ≥ 0.05; t-test).

