
Fig. 5.
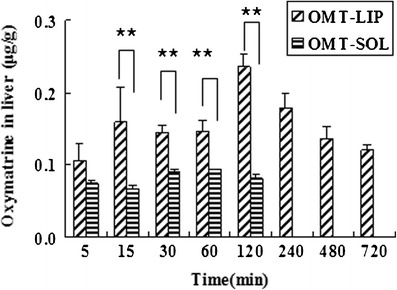
Biodistribution of OMT-LIP in the fibrotic liver post-intravenous injection in comparison with OMT-SOL. **P < 0.05. At 240, 480, and 720 min, the OMT levels were below the detection limit in OMT-SOL. Error bars refer to standard deviations (n = 3)