
Fig. 6.
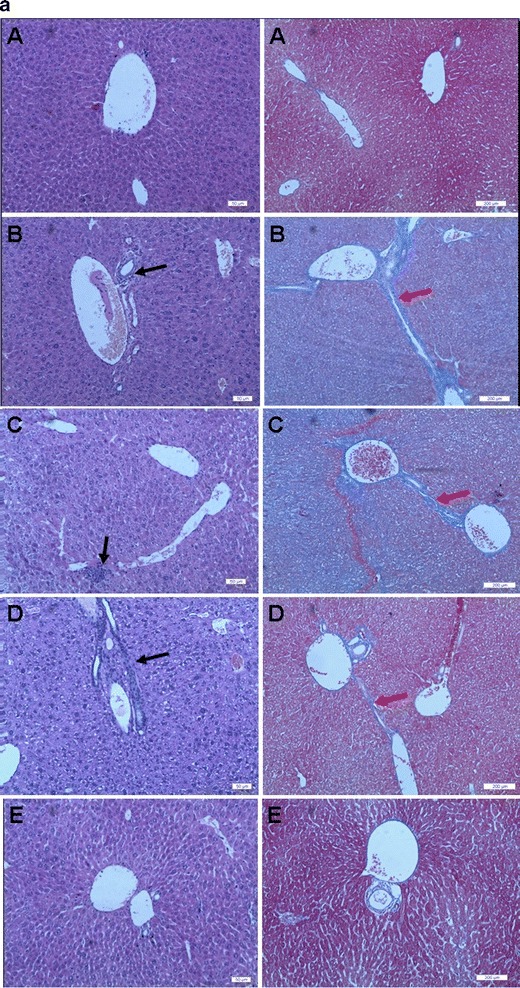
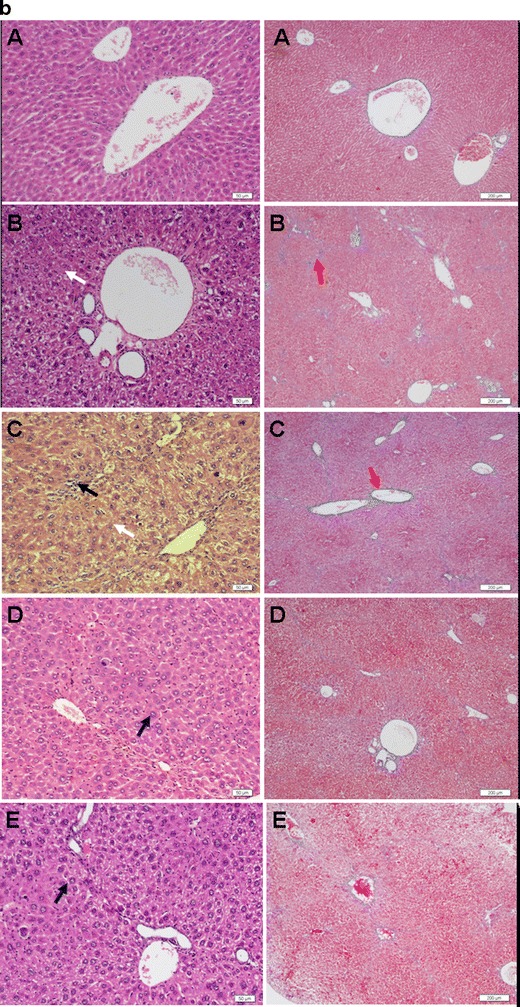
Representative photographs of cross-sections of liver in mice with liver fibrosis induced by DMN (a) and in mice with liver fibrosis induced by CCl4 (b) (A, healthy group; B, saline control group; C, empty liposome group; D, OMT-SOL group; E, OMT-LIP group). Black arrow, inflammatory cells; white arrow, necrotic hepatocytes; blue arrow, swollen hepatocytes; yellow arrow, fatty degeneration; red arrow, deposited collagens. Left panel Hematoxylin–eosin staining. Bar, 50 μm. Right panel Masson’s trichrome staining. Bar, 200 μm