
Fig. 7.
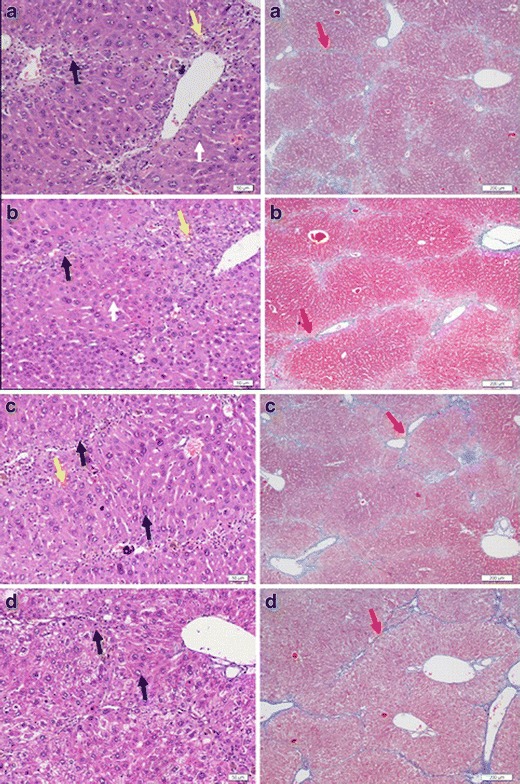
Representative photographs of cross-sections of liver in the prophylactic study against liver fibrosis induced by CCl4: saline control group (a), empty liposome group (b), OMT-SOL group (c), OMT-LIP group (d). Black arrow, inflammatory cells; white arrow, necrotic hepatocytes; blue arrow, swollen hepatocytes; yellow arrow, fatty degeneration; red arrow, deposited collagens. Left panel Hematoxylin–eosin staining. Bar, 50 μm. Right panel Masson’s trichrome staining. Bar, 200 μm