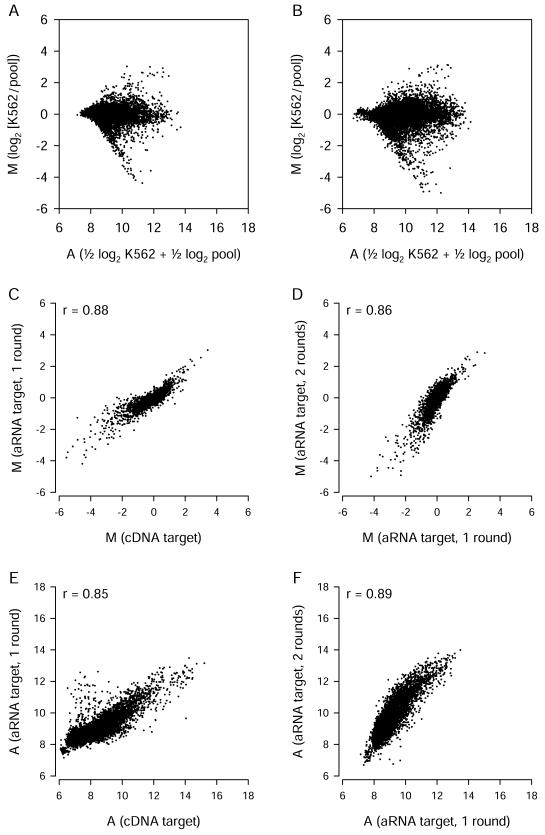
Figure 6.
Amplified targets used with Version 1 spotted long oligonucleotide arrays. (A) Expression data from six replicate arrays hybridized with cRNA targets produced using a single round of amplification. (B) Data from two replicate arrays with cRNA targets produced using two rounds of amplification. (C, D) Comparisons of M values obtained using unamplified and amplified targets, after exclusion of probes with low A values. After exclusion of low-intensity signals, 5746 probes (C) or 5771 probes (D) of 13,971 total probes remained for comparison. (E, F) Signal intensity values for unamplified and amplified targets. Each point represents data from a single probe.

