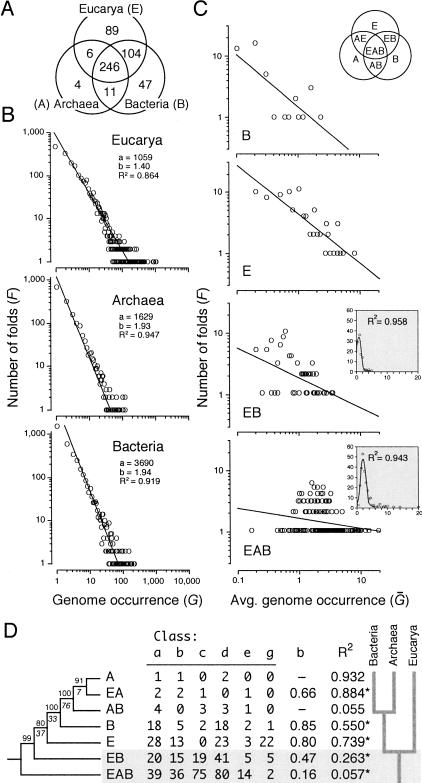
Figure 1.
Fold distribution, power-law behavior, and history of fold diversification in the three domains of life. (A) The Venn diagram shows the distribution of phylogenetically informative SCOP 1.59 folds in Eucarya, Archaea, and Bacteria (genomes analyzed are described in Fig. 2). (B) The double logarithmic plots show the relationship between the frequency (F) of a protein fold exhibiting a certain attribute and the attribute itself. In this case, the attribute is fold occurrence (G). The relationship between frequency and occurrence was fitted to a straight line (R2 = 0.864–0.947; P < 0.001) that drops off sharply and similarly for each genome (plots not shown) or group of genomes, according to a power law defined by constants a and b. This behavior follows Zipf's law, a description of the frequency of words in natural languages. (C) Double logarithmic plots also show the relationship between the frequency of folds with a particular pattern of distribution and the average number of times these folds occur in genomes within one or more organismal domains, normalized to a 0–20 scale (Ḡ). The nomenclature of patterns of fold distribution is described in the Venn diagram (inset). All plots show significant linear correlations (P < 0.05; see below). However, values in the EAB and EB plots (binned to reduce noise in the data) can be best fitted to a Poisson distribution (P = 0.001) (insets). (D) The table shows the number of folds in the six classes of protein structure (named according to SCOP nomenclature) present in different distribution patterns among organismal domains, together with decay indices and coefficients of linear correlation (R2) describing the fit to a power law (*, P < 0.05). These values were coded (0–26) and weighted (4, 2.5, 3.5 6, 1, and 1, respectively) to compensate for fold representation differences. A single rooted tree of 520 steps (CI = 0.901, RI = 0.925; g1 = -1.460; PTP, P = 0.001) was recovered after an exhaustive search (D). BS values >80% are shown above nodes, and double decay indices below them (CIC = 13.34).

