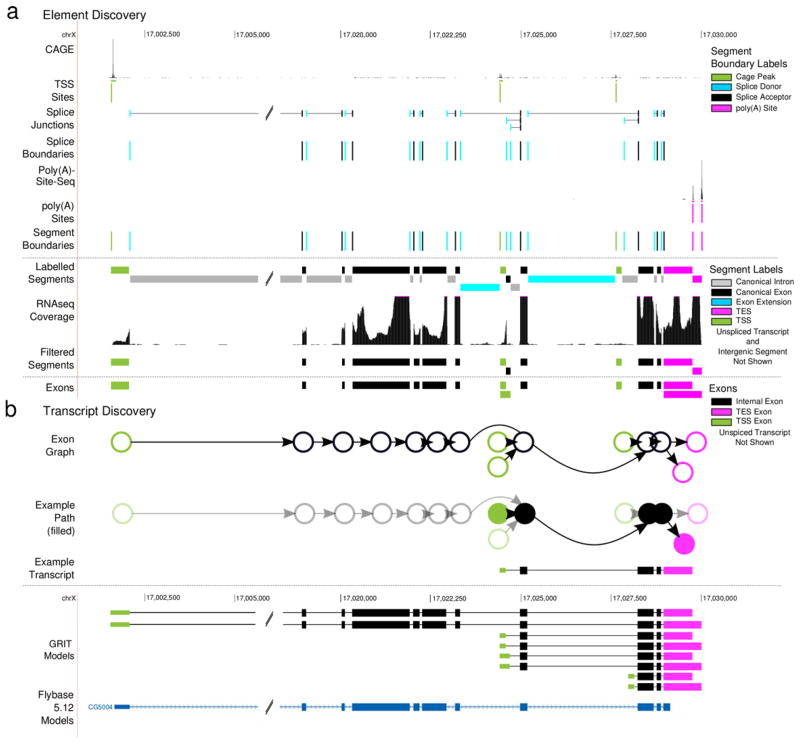
Figure 1. Element discovery overview.
(a) Exon discovery. For each gene segment we identify CAGE peaks; segment the gene region using the CAGE peaks, splice boundaries and poly(A) sites; label the segments based upon their boundaries; filter intron segments with low RNA-seq coverage; and build labeled exons from adjacent segments. (b) Transcript discovery. For each gene, we construct a graph where each node is an exon discovered in (b), and each edge is a junction. Then, each candidate transcript is identified with a single path through this directed graph that begins with TSS node, and ends with a TES node.

