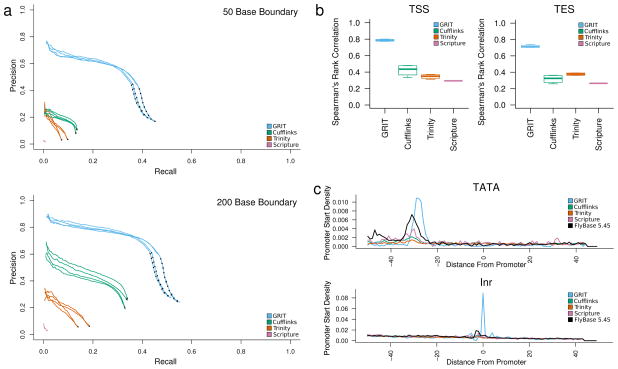
Figure 2. Comparison with existing tools.
(a) Recall and precision analysis. We compared the set of transcript isoforms discovered by GRIT, Cufflinks, Scripture and Trinity to the FlyBase annotation. A transcript was identified as a match if the internal structure was the same, and the distal boundaries were, variously, within 50 and 200 bp of one-another. (b) FPKM versus CAGE and poly(A)-site-seq counts. For each sample, we calculated the Spearman rank correlation between estimated transcript FPKMs and raw CAGE and poly(A)-site-seq read counts within 50 bp of each annotated promoter/poly(A) site. (c) Motif analysis. For each sample, we considered the sequence within 50 bp of annotated promoters. A position was considered a TATA motif hit if it matched the sequence “T-A-T-A-A”, and an Inr motif match if it matched the sequence “C/T-C/T-A-N-A/T-C/T-C/T”. The plots are aligned with respect to the first base in the annotated promoter, and plot the fraction of promoters that contain a motif match at each position, averaged over replicates.

