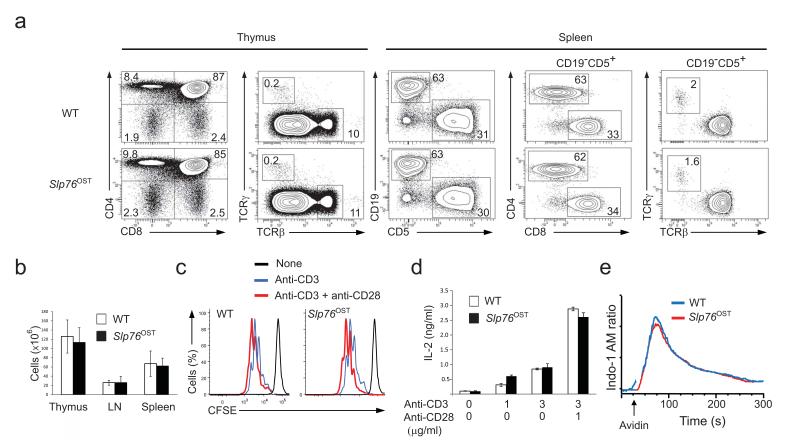
Figure 1.
Normal development and function of T cells isolated from knock-in mice homozygous for the Slp76OST allele. (a) Flow cytometry analysis of thymus and spleen.Thymocytes from wild-type (WT) and Slp76OST (also known as B6-Lcp2tm2Mal) mice were analyzed for expression of CD4 and CD8 (left) and TCRαβ and TCRγδ (right). Numbers adjacent to outlined areas indicate percent double-positive cells (top right), CD4+ single-positive cells (top left), CD8+ single-positive cells (bottom right) and double-negative CD4− CD8− cells (bottom left). Wild-type and Slp76OST splenocytes were analyzed for expression of CD5 (a marker specific of T cells) and CD19 (a marker specific of B cells). Numbers adjacent to outlined areas indicate percent B cells (upper left) and T cells (bottom right). The expression of CD4 and CD8 and of TCRαβ and TCRγδ by T cells (identified as CD19−CD5+ cells). Numbers adjacent to outlined areas indicate percent CD4+ and CD8+ cells (middle) and TCRαβ and TCRγδ cells (right). Data are representative of at least three experiments with two mice per genotype. (b) Cellularity of thymus, pooled axillary, brachial, inguinal and mesenteric lymph nodes (LN) and spleen from wild-type and Slp76OST mice. Data are expressed as mean value ± SEM (n = 6). (c) CFSE dilution by wild-type, and Slp76OST CD4+ T cells activated for 72 h with plate-bound anti-CD3 (3 μg/ml) in the presence or absence (key) of soluble anti-CD28 (1 μg/ml). Dotted lines, CFSE dilution at initiation of culture. (d) IL-2 in supernatants of wild-type, and Slp76OST CD4+ T cells activated for 72 h as in (c). (e) Changes in intracellular calcium in wild-type, and Slp76OST CD4+ T cells stimulated with biotinylated anti-CD3 and avidin. Arrow corresponds to the time of addition of avidin. Data are representative of at least two experiments. Corresponding results for Zap70OST and LatOST T cells are shown in Supplementary Figures 2,3.

