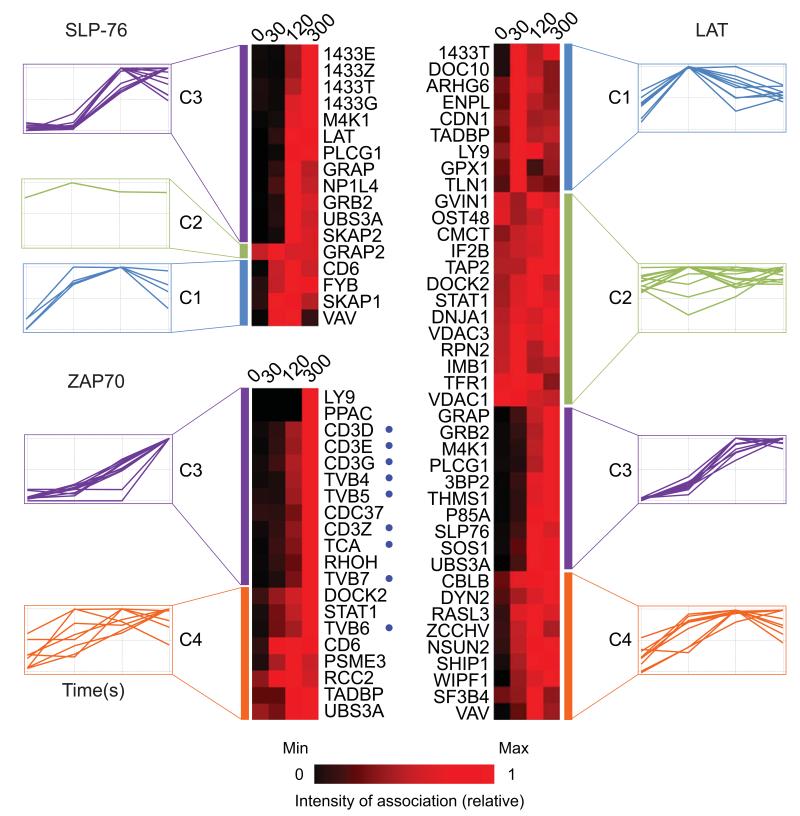
Figure 4.
Kinetics of protein binding to the Zap70, Lat and SLP-76 baits. The kinetics of binding to a given protein bait after stimulation were determined by label-free quantitative analysis and interacting proteins were clustered based on their similarities. Four distinct clusters (C1 to C4; see margin of each heat map) were identified using Euclidean distance correlation. The names of the proteins are indicated in the margin of each heat map (see description in Supplementary Table 1). Time is shown in seconds above each heat map; time 0 corresponds to unstimulated CD4+ T cells. Relative levels of association are shown in rainbow-like, false-color scale increasing from black to red. Blue dots represent molecules belonging to TCR-CD3 complex. Data are representative of three independent experiments involving three biological replicates each.

