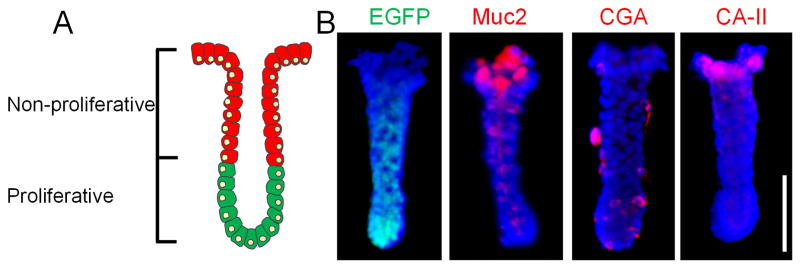
Figure 1.

Tissue polarity of colonic crypts. (A) A simplified schematic of colonic crypts possessing distinct proliferative (green cells) and non-proliferative (red cells) zones. (B) EGFP (green) fluorescence and immunofluorescence staining of Muc2, CGA and CA-II (red). Nuclei were stained with Hoechst 33342 (blue). Scale bar = 100 μm.
