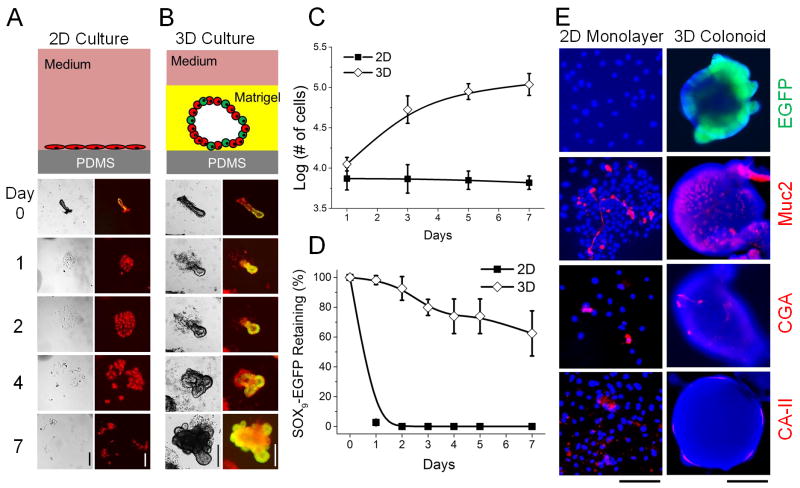
Figure 2.
Comparison between 2D and 3D culture of crypts on or over a PDMS planar surface. (A) 2D culture. (B) 3D culture. (A–B) Top panels are schematics of the culture system. Bottom panels are brightfield (left) and overlaid images of EGFP and DsRed fluorescence (right) of crypt fate over time. (C) Cell number vs. time in 2D and 3D culture systems. Both contained the same number of crypts (1,000) at time point 0. (D) EGFP expression vs. time for crypts cultured in 2D and 3D. (E) EGFP (green) fluorescence image and immunofluorescence staining of Muc2, CGA and CA-II (red) for 2D monolayers (left panel) and 3D colonoids (right panels). Nuclei were stained with Hoechst 33342 (blue). Time in culture was 7 days. Scale bars = 200 μm for images in A, B and F.

