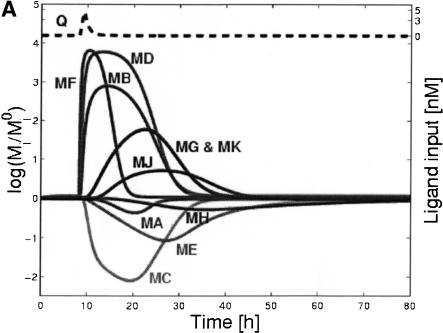
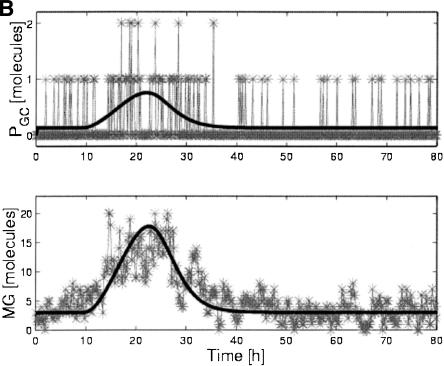
Figure 2.
Representative time courses from the model. (A) Loge (expression ratios) vs. time for all genes (shaded lines) and ligand (dashed line) from deterministic simulation in response to a pulse of ligand. (B) Comparison of stochastic and deterministic simulations for the unrepressed G promoter (PGC) and the G transcript: PGC and MG vs. time. Note that the stochastic simulation accounts for the fact that there can only be 0, 1, or 2 molecules of PGC/cell at any given time.


