
Figure 7.
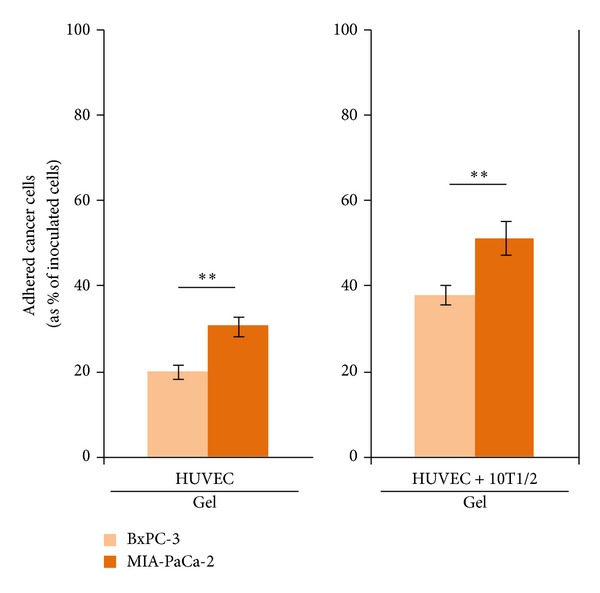
BxPC-3 and MIA-PaCa-2 adhesion in the HUVECs only and HUVECs + 10T1/2 in the collagen gel cultures. Columns and error bars represent mean ± SEM of two independent experiments. Each independent experiment had six wells for each culture condition. Statistical significance is shown using symbols *(P < 0.05), **(P < 0.01), and ***(P < 0.001).