
Fig. 2.
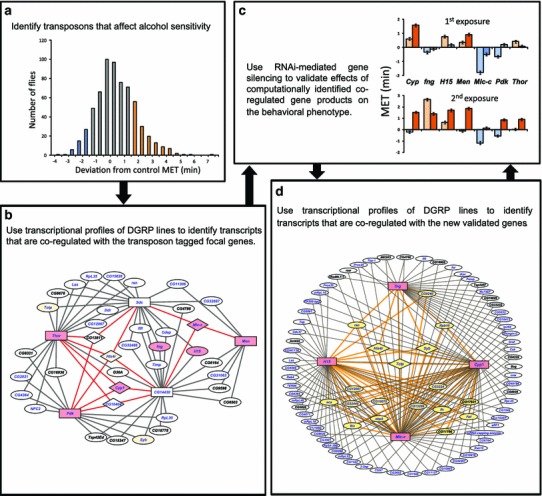
A strategy for the construction of genetic networks that underlie alcohol sensitivity in Drosophila melanogaster. The diagrams illustrate an iterative approach that combines P-element insertional mutagenesis (a), computational analysis of transcriptional profiles of DGRP lines (b, d) and RNAi-mediated target gene silencing (c) to generate a comprehensive network for alcohol sensitivity. a P-element insertional mutagenesis screen for alcohol sensitivity. Blue and orange colored bars designate lines with higher and lower alcohol sensitivity than control. b A network of co-regulated candidate genes associated with alcohol sensitivity. Rectangles indicate the most highly connected focal genes; genes targeted for validation studies are shown on pink and yellow backgrounds, and genes with annotated human orthologs are indicated in blue font. c Differences in mean elution time (MET) among RNAi lines after a first and a second exposure to ethanol. Blue bars indicate sensitive lines with MET lower than the control (P < 0.05); orange bars indicate resistant lines with MET higher than the control (P < 0.05); gray bars indicate no significant difference in MET. d An expanded network for alcohol sensitivity derived from highly interconnected genes from panel b is shown in pink boxes. Genes connected to two focal genes are shown at the periphery of the circle in white ovals and connected by gray lines. Genes interconnected by three and more networks are indicated on a yellow background and connected by orange lines. Diamond shapes indicate genes connected to all four focal genes. Genes with annotated human orthologs are indicated in blue. Modified from Morozova et al. (2011)