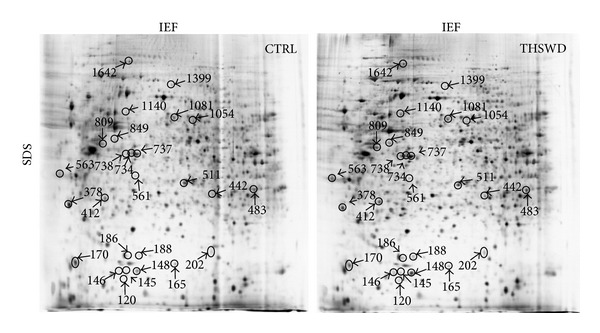
Figure 2.

Representative proteome profiles of PC12 cells with and without exposure to THSWD. Cells were treated with THSWD (1 mg·mL−1) for 24 h and with vehicle as control. Total protein extracts were separated on pH 3–10 nonlinear IPG strips in the first dimension followed by 12.5% SDS-PAGE in the second dimension and were visualized by silver staining. A total of 26 differentially expressed spots were identified by MALDI-TOF/TOF mass spectrometer (marked with circle, arrow, and number).
