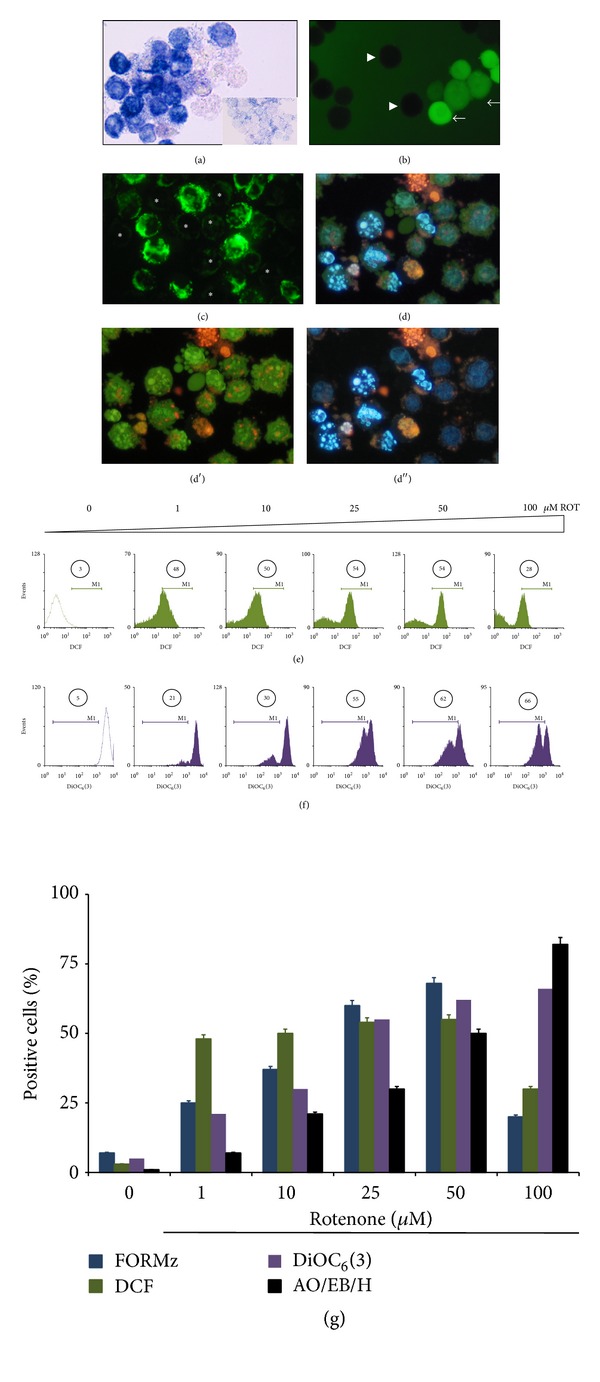
Figure 1.

Rotenone (ROT) induces reactive oxygen species, mitochondrial depolarization, and chromatin condensation/nuclei fragmentation in Jurkat T leukemia cells. (a) Representative light photomicrography showing positive nitroblue tetrazolium (NBT+) stained blue-purple precipitate cells (i.e., formazan: FORMz) as positive O2 ∙− generation in Jurkat cells cultured in basal glucose medium containing 11 mM glucose (G11) treated with (50 μM) ROT for 24 h. Inset: untreated cells showing negative NBT staining. (b) Fluorescent photomicrography (ex. 450–490 nm, em. 515 nm) illustrating positive 2′,7′-dichlorofluorescein (DCF, arrows) and negative (arrowheads) stained cells as positive/negative H2O2 production from Jurkat T cells cultured in G11 treated with (50 μM) ROT for 24 h. (c) Representative fluorescent photomicrography (ex. 450–490 nm, em. 515 nm) illustrates positive green fluorescent stained cells as DiOC6(3) high-polarized and low-polarized mitochondria and depolarized mitochondria (asterisk) from treated cells with (50 μM) ROT in G11 for 24 h. (d) Representative (merge image) fluorescent photomicrography showing treated cells with (50 μM ) ROT in G11 for 24 h with condensed chromatin (stage I nuclei morphology) and DNA fragmentation (stage II nuclei morphology) analyzed by either AO/EB ((d′), ex. 450–490 nm, em. 515 nm), Hoechst staining ((d′′), ex. 354 nm, em. 442 nm). (e) Representative histograms showing the percentage of dichlorofluorescein positive (DFC+) cells. (f) Percentage of DiOC6(3) low (DiOC6(3)−) cells exposed to increasing concentration of ROT (0–100 μM), assessed at 24 h. (g) The percentage of positive FORMz, DCF, DiOC6(3), and AO/EB/Hoechst cells exposed to increasing concentration of ROT (0–100 μM) is expressed as a mean percentage ± S.D. from three independent experiments. Magnification ((a)–(d)) 1000x. Magnification inset (a) 600x.
