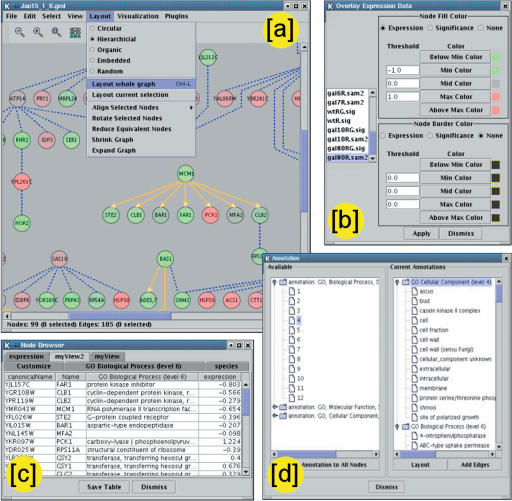
Figure 1.
Tour of Cytoscape core functionality. (a) Available network layout algorithms are accessed via the menu system; an example hierarchical layout is shown. (b) The data attribute-to-visual mapping control is used to integrate a variety of heterogenous data types on the network. Here, gene expression data are mapped to node color for the condition named “gal80R,” in which color is interpolated between green (negative values) and red (positive values) through gray as the midpoint. Node colors in a are derived using this mapping. (c) Attributes are displayed for selected nodes and edges in a browser window. As shown, multiple attributes and genes may be displayed in a customtabular format. (d) Annotations are transferred to node and edge attributes by choosing the desired ontology and hierarchical level from a list of those available.

