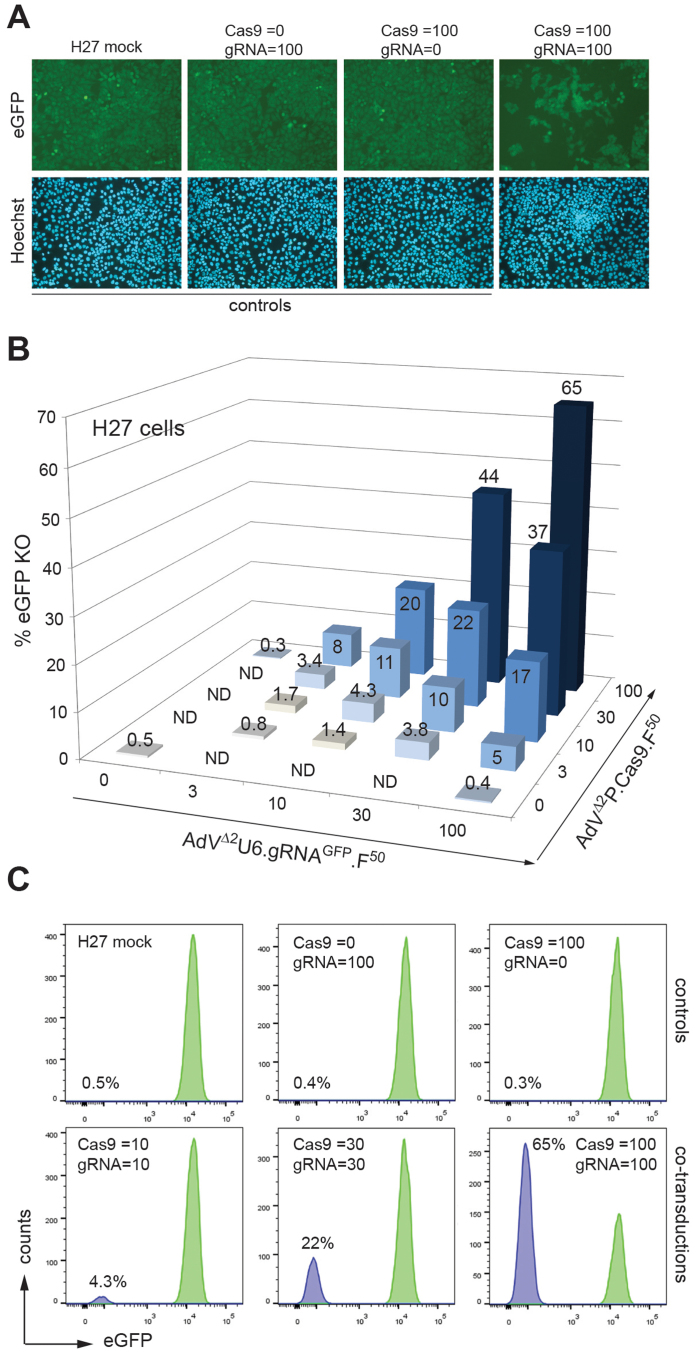
Figure 8. Analyses of target gene editing frequencies in human H27 cells transduced with AdVs encoding eGFP-directed RGN complexes.
(A) Fluorescence microscopy on cultures of eGFP-expressing H27 cells co-transduced with a 1:1 mixture of AdVΔ2P.Cas9.F50 and AdVΔ2U6.gRNAGFP.F50 applied at total MOI of 200 TU/cell (Cas9 = 100; gRNA = 100). Negative controls consisted of mock-transduced H27 cells and of H27 cells transduced with AdVΔ2U6.gRNAGFP.F50 alone at an MOI of 100 TU/cell (Cas9 = 0; gRNA = 100) or with AdVΔ2P.Cas9.F50 alone at an MOI of 100 TU/cell (Cas9 = 100; gRNA = 0). Cell nuclei and eGFP-expressing cells in each field were identified via Hoechst 33342- and eGFP-directed fluorescence microscopy, respectively. Note the presence of eGFP-negative cells in cultures transduced with both vector types. (B) Flow cytometry-based quantification of target gene knockout levels in H27 cell cultures transduced with AdVΔ2P.Cas9.F50 and AdVΔ2U6.gRNAGFP.F50 at the indicated MOIs (in TU/cell). ND, not done. (C) Representative flow cytometry histograms corresponding to data points presented in Fig. 8B. The analyses of target gene knockout by fluorescence microscopy and flow cytometry were both performed at 15 days post-transduction.

