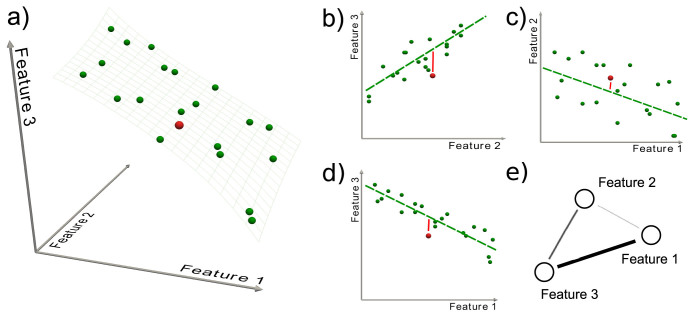
Figure 1. Schematic representation of the parenclitic network reconstruction method.
(a) Graphical represetation of the initial data set, composed of 20 instances (systems) and three features. Each instance is represented by a green sphere, located according to the value of its features in a 3-dimensional space. The constraint surface (gray wired surface) represents the overall standard relationship  of the class. A generic unlabeled system is represented by a red sphere. (b–d) Data are then projected on each of the three possible planes. The green dashed lines represent the models extracted in each plane, i.e.
 . The red points are the positions of the unlabeled system, and the red lines indicate the distance of the system from the models. (e) The resulting parenclitic representation is a network where nodes are associated to features, and links are weighted according to the calculated distances (coded, in this Figure, into different line widths).

