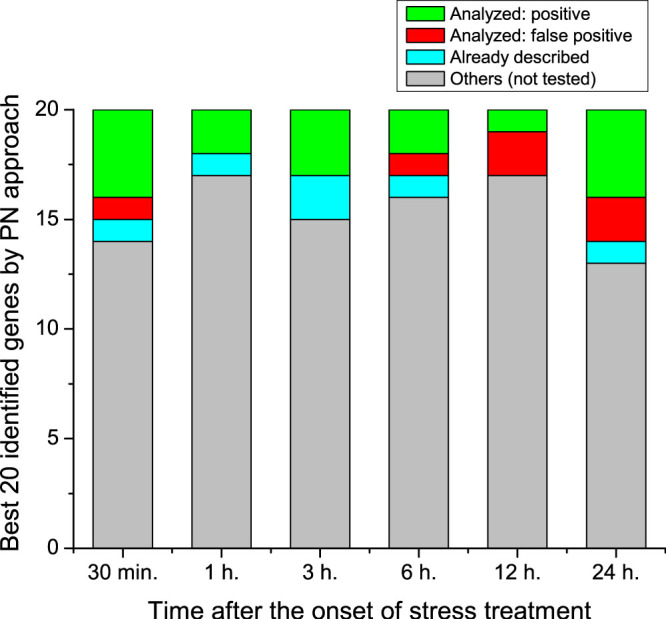
Figure 5. Outcome of the experimental results.

Bars account for the 20 most central genes at each time step. For the six time steps considered, bar colors are coded according to the following stipulations: genes previously considered not to be involved in the plant's response to osmotic stress, that were respectively experimentally proven to develop (green) or to fail to develop (red) a statistically significant difference in the phenotype with respect to the wild-type phenotype; (cyan) genes predicted by the parenclitic analysis that were previously associated with the stress response in the Literature; and (gray) previously unknown genes, which could not be tested experimentally, due to their unavailability in the TRANSPLANTA collection.
