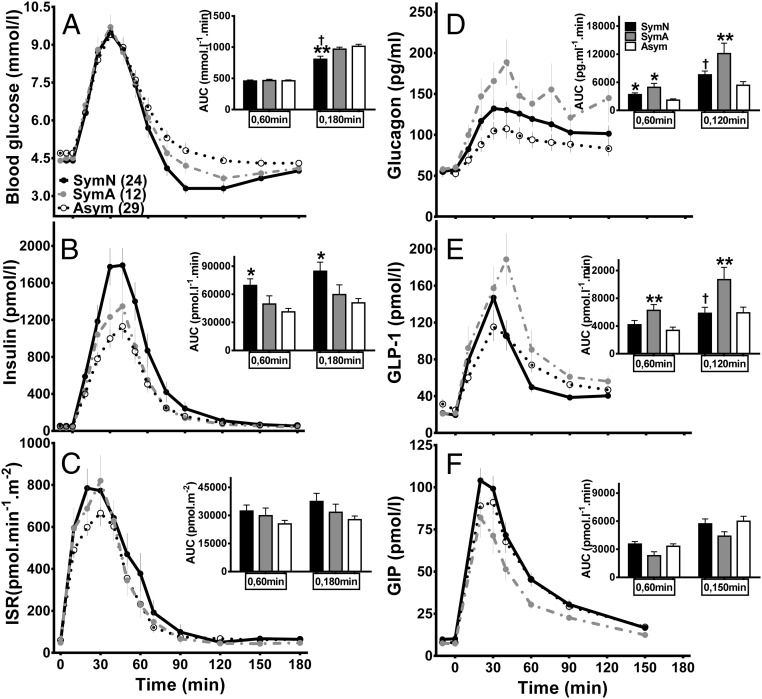
Figure 2.
Plasma glucose (A), islet hormone (B–D), and incretin (E and F) responses to meal ingestion in postsurgical subjects categorized by previous clinical symptoms. Neuroglycopenic symptoms (SymN, solid line and closed circle, black bar); autonomic symptoms (SymA, gray dashed line and closed circle, gray bar); and asymptomatic (Asym, dashed line and open circle, white bar). †, P < .05, compared to SymA; *, P < .05, and **, P < .01, compared to Asym using post hoc analysis.

