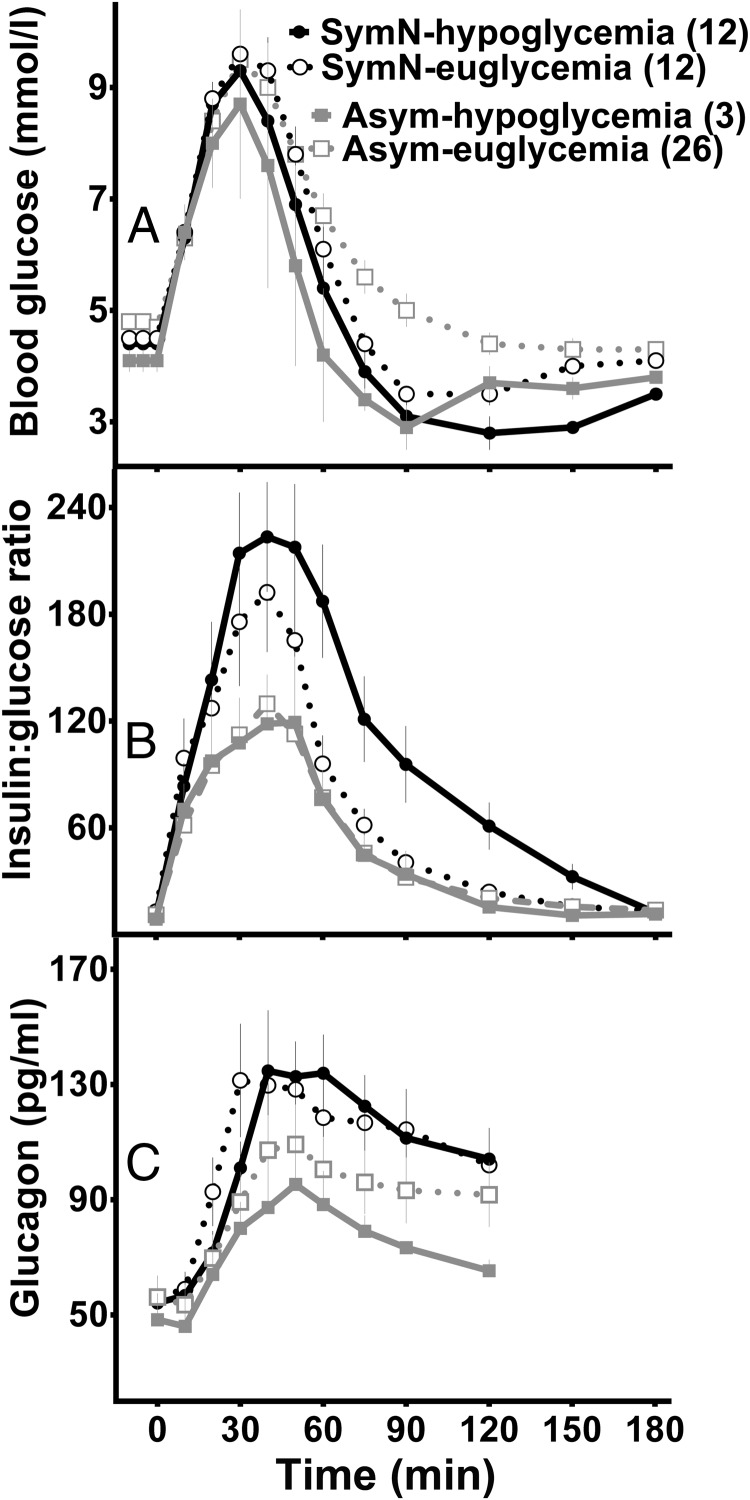
Figure 3.
Plasma glucose (A), insulin:glucose ratios (B), and glucagon response (C) in postsurgical subjects stratified by previous clinical symptoms and glycemic response during the MTT. Neuroglycopenic symptoms and hypoglycemia during MTT (SymN-hypoglycemia, solid line and closed circle); neuroglycopenic symptoms and blood glucose ≥2.78 mmol/L during MTT (SymN-euglycemia, dashed line and open circle); asymptomatic and hypoglycemia during MTT (Asym-hypoglycemia, gray solid line and closed square); asymptomatic and blood glucose ≥2.78 mmol/L during MTT (Asym-euglycemia, gray dashed line and open square).

