
Figure 1.
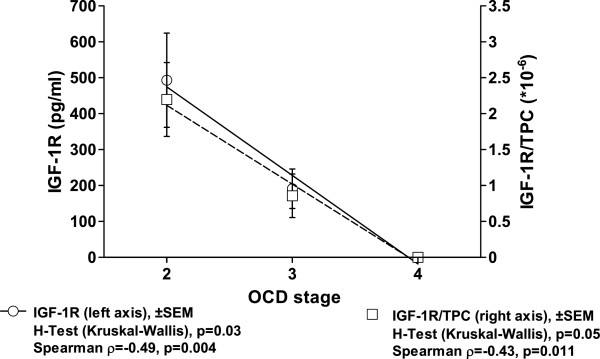
Decreasing intraarticular levels of IGF-1R are observed with progress of oa in the ankle measured by grading of ocd according to berndt and harty. results of the spearman correlation are indicated for absolute IGF-1R levels and concentrations in relation to the total protein content (tpc) on the bottom. the curve fit shows the results of a regression analysis (r2 = 0.99), which was confirmed by the Kruskal-Wallis H-test.