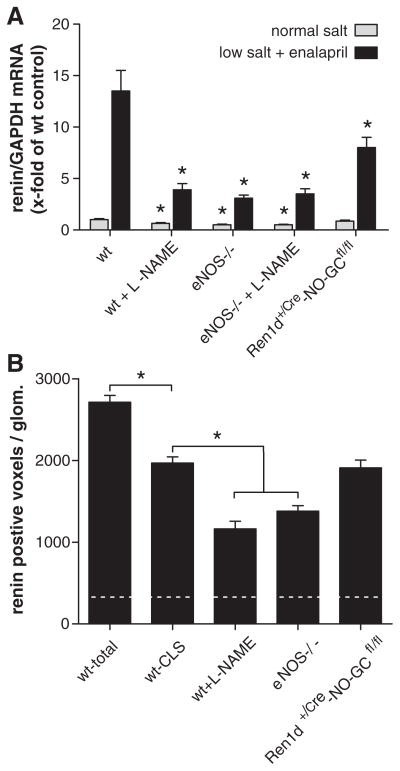
Figure 2.
A, Kidney renin mRNA abundance before and after 3 weeks of treatment with low-salt (LS) diet+enalapril in wild-type (wt) mice, in wt mice treated with L-NAME, in mice lacking endothelial isoform of nitric oxide synthase (eNOS−/−), in eNOS−/− treated with L-NAME and Ren1d+/Cre–NO-sensitive guanylate cyclase (NO-GC)fl/fl mice (n=5/group). For Ren1d+/Cre–NO-GCfl/fl mice, Ren1d+/+–NO-GCfl/fl mice were considered as wt controls. Renin mRNA levels were not different between C57Bl6 and Ren1d+/+–NO-GCfl/fl mice. Data are means±SE of 5 animals in each group. Asterisks indicate P<0.05 between respective wt controls. B, Renin-immunoreactive volume (voxels) per glomerulus calculated from 3D-reconstructions. Dotted horizontal line reflects renin-immunoreactive volume per glomerulus of untreated wt mice. Wt-total indicates total (juxtaglomerular and afferent arteriolar) immunoreactive volumes per glomerulus in wt mice after treatment with LS/enalapril. Wt cuff-like structures (CLS) indicates juxtaglomerular renin-immunoreactive volume within the first 30 μm from the glomerular vascular pole, considered as measure of juxtaglomerular hypertrophy. For wt mice treated with L-NAME, eNOS−/− mice, and Ren1d+/+–NO-GCfl/fl mice on LS/ enalapril only, renin-immunoreactive volumes within the first 30 μm from the glomerular vascular pole are shown, which, however, were identical to the respective total renin-immunoreactive volumes, because there was no renin expression beyond 30 μm from the glomerular vascular poles in these mice. Data are means±SEM of 60 glomeruli analyzed from 3 kidneys per group. *P<0.05 vs wt CLS.

