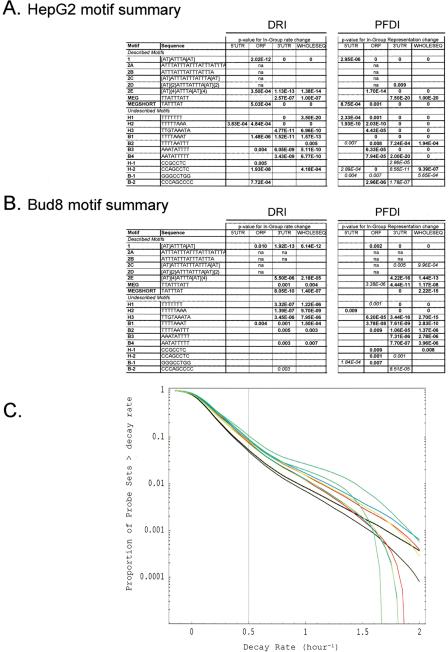
Figure 2.
Motif analysis of decaying transcripts in human cells. (A,B) The probe sets from the four HepG2 experiments (A) or the Bud8 experiment (B) were analyzed for the relationship between transcript decay and the presence of particular sequence motifs. The results of DRI and PFDI (same procedures used in Fig. 1) are summarized in A and B. For the motif analysis, we performed separate inferences for portions of the sequence (3′-UTR, 5′-UTR, ORF) and the cDNA sequence considered as a whole. For DRI, we compared the average decay rate of the probe sets from genes containing the motif in a specified location with rates of all other probe sets: significant (99% probability or greater) increases are shown in bold and significant decreases in italics. For PFDI, motifs that are overrepresented in the rapidly decaying transcript pool (r > 0.5 h-1) when located in a given position are shown in bold; underrepresented transcripts are shown in italics (again, 99% probability cutoff for both). Motif–location combinations without statistically significant changes are shown as blank, and combinations with too few probe pairs for inference (≤25 probe pairs) are indicated with “n.a.” For more details on the motif analysis (e.g., extent of shift in average decay rate, percent enrichment), see Supplemental Tables 4–6. (C) Reverse cumulative distribution of decay rates for probe sets from genes that contain particular sequence motifs in their 3′-UTR (HepG2 experiment). Decay rate r is shown horizontally, while vertically the fraction of probe sets with decay rates higher than r is plotted on a logarithmicscale. The pairs of lines show the 98% posterior probability intervals for the fraction at each value of r. (Red) Motif 1; (blue) motif MEGSHORT; (green) Motif 2E; (light green) Motif H1; (black) all probe sets. “Described” AU-rich decay motifs (1–2E, MEG, MEGSHORT) and “undescribed” motifs were derived from the sources mentioned in Methods.

