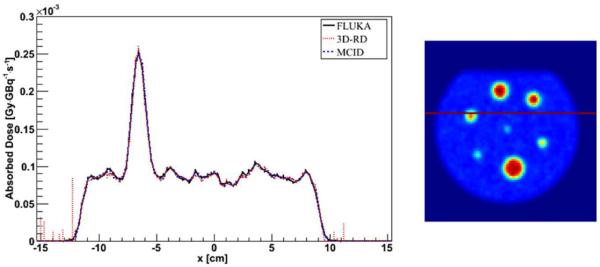
Figure 3.

Profile comparison between FLUKA, 3D-RD and MCID DMC simulation in water (PET_1 phantom). Error bars are not visible because they are fully included in the lines, except for the region outside the phantom (at the profile edges) exhibiting low statistic.
