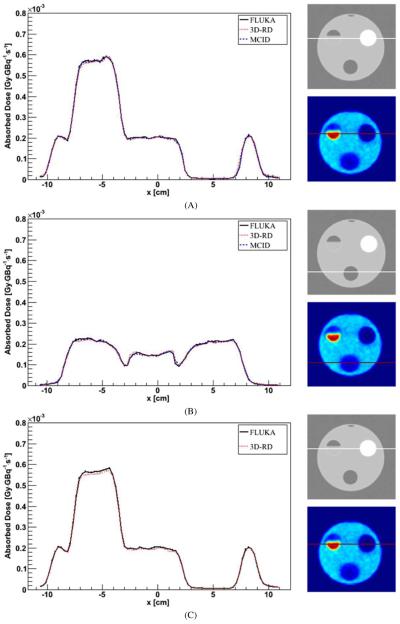
Figure 7.
Profile comparison for DMC simulation with a CT-based density map and air–water–bone segmentation (A), lung–water–bone segmentation (B) and Schneider segmentation (C). The profile crosses the bone insert (A), (B) or the lung insert (B). Error bars are not visible because they are fully included in the lines.

