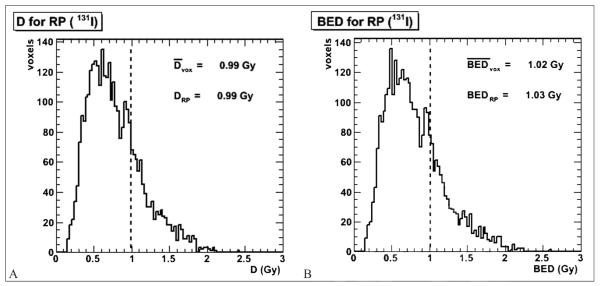
Figure 4.
Absorbed dose (A) and BED (B) DVHs for patient 1. The dotted line represents the average voxel absorbed dose (or BED). The “RP” suffix designates the value representing the overall (i.e., not voxel-averaged) salivary gland (right parotid) dose from Figure 3A, given for comparison.

