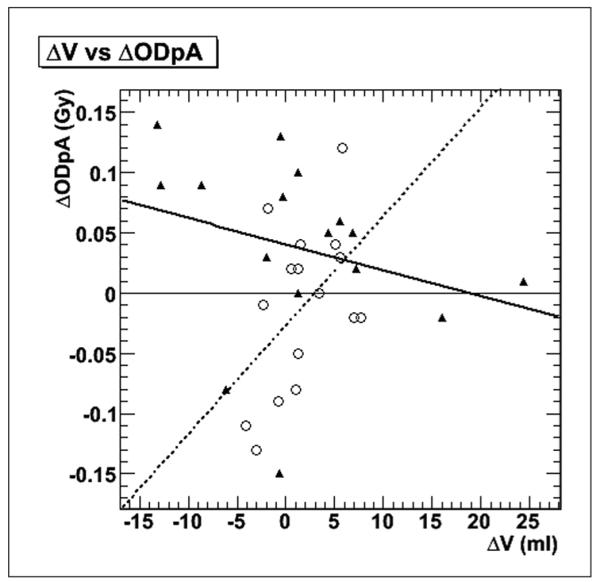
Figure 6.

Gland-by-gland comparison of volume difference versus ODpA difference between methods. The white circles and dotted line are for the submandibular gland results, while the black triangles and solid line represent the parotid gland data and fit.
