Figure 3.
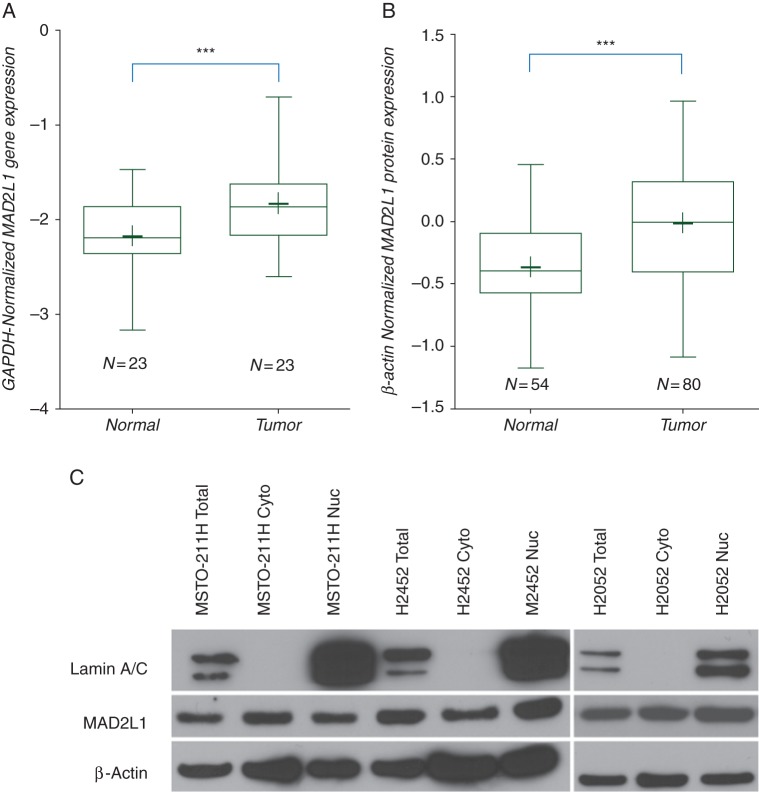
Transcript and protein analysis of MAD2L1 in tumors and cell lines. (A) qPCR analysis of MAD2L1 message in MPM tumor samples compared with normal paired samples. Twenty-three paired samples were analyzed for MAD2L1 expression using qPCR assays with GAPDH as normalizing endogenous controls and 2−ΔCt were plotted on a log10 scale to compare between the sets. The box plot shows expression in the tumors was significantly higher compared with paired normal control samples with a 3-fold difference in the means (***P = 0.0036). The ‘+’ marks the mean for the box plots. (B) MAD2L1 protein expression in tumor tissue. Western blots of tumor (N = 80 cases) and normal (N = 54 cases) were probed for MAD2L1- and β-actin-specific antibodies. After scanning, quantizing and normalizing the autoradiograms, the tumors show 2.7-fold increase in mean value of MAD2L1 protein, compared with β-actin (***P < 0.0001). The normalized intensity values were plotted on the Y-axis on a log10 scale. The ‘+’ marks the mean for the box plots. (C) Western blot analysis of three MPM cell lines. Protein lysates isolated from different cellular compartments were probed with MAD2L1- and control biomarkers-specific antibodies. The nuclear (Nuc), cytoplasmic (Cyto) and total (Total) levels of MAD2L1 protein are depicted in the blot. Nuclear lamin A and Nuclear lamin C serve as controls for presence of nuclear proteins while β-actin serves as loading control.

