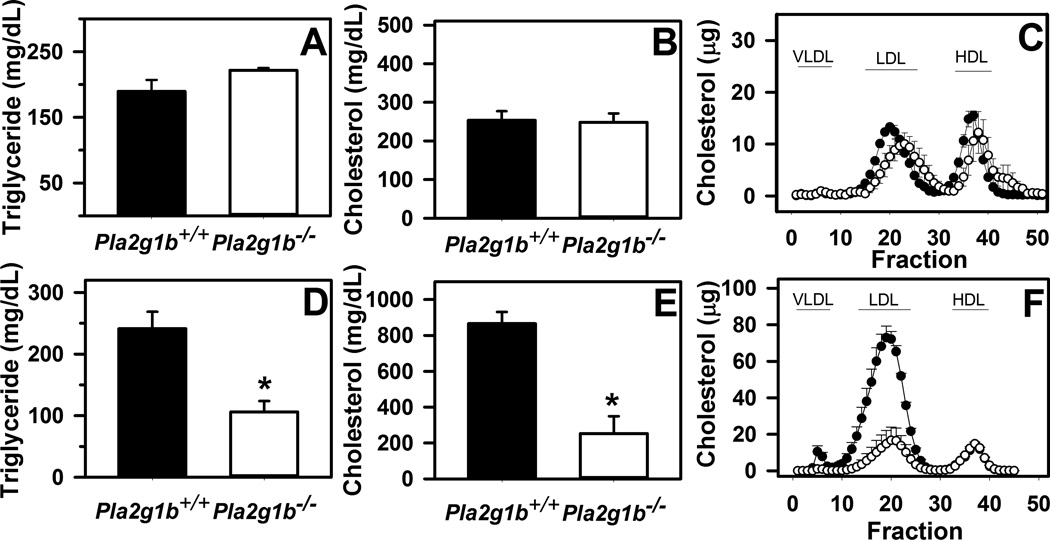
Figure 1. Fasting plasma lipid levels in Pla2g1b+/+Ldlr−/− and Pla2g1b−/−Ldlr−/− mice.
Male Pla2g1b+/+Ldlr−/− (filled bars and symbols) and Pla2g1b−/−Ldlr−/− mice were fed low fat chow diet (A–C) or hypercaloric diet (D–F) for 10 weeks. Animals were fasted overnight prior to obtaining blood samples to measure plasma triglyceride (A,D) and cholesterol (B,E) levels. An 100 µL of the samples were fractionated on FPLC to determine lipid distribution among the various lipoprotein fractions compared to standards as indicated (C,F). Data represent mean ± SEM from 4–6 mice in each group. * denotes differences from Pla2g1b+/+Ldlr−/− mice at P < 0.01.

