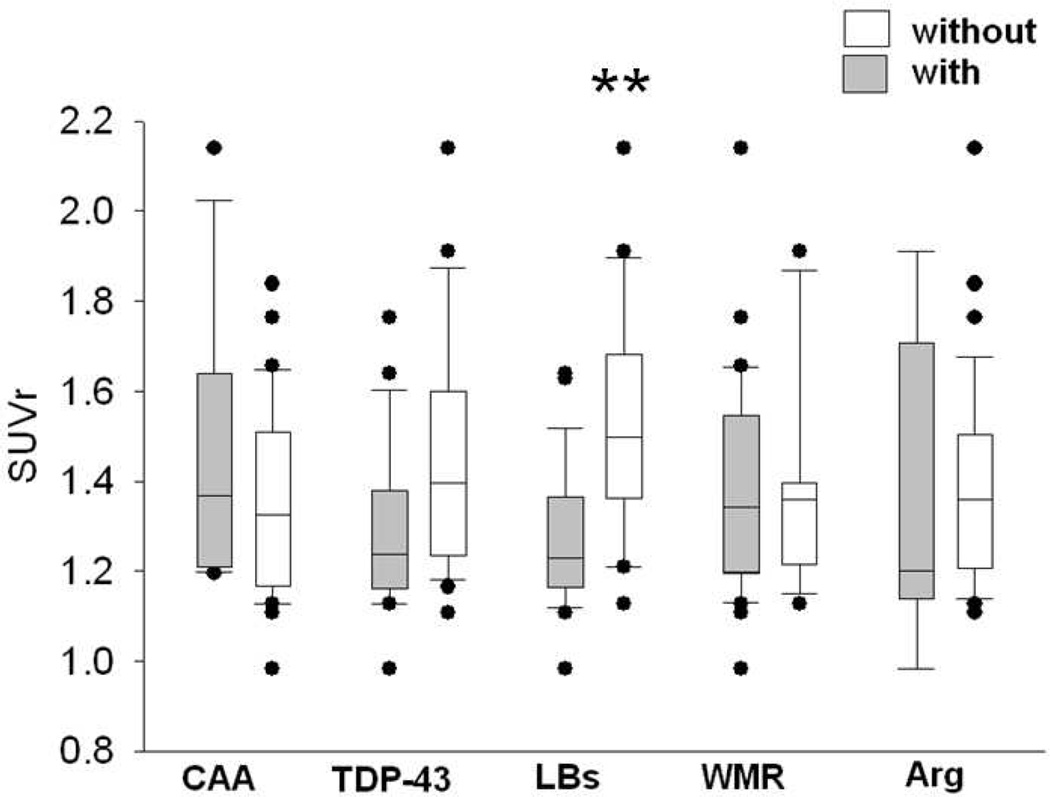
Fig. 3.
Box plots of median, 25th and 75th percentile of in vivo amyloid imaging measures for average cortical amyloid load of Alzheimer’s disease cases using the standard uptake value ratios (SUVr) in subjects with presence (gray boxes) or absence (white boxes) of concurrent pathologies: (CAA; with N = 11; without N = 27), TDP-43 (with N = 18; without N = 20), LBs (with n = 21, without N = 17), WMR (with N = 27, without N = 11), and Arg (with N = 5, without N = 33). Whiskers above and below the box indicate the 90th and 10th percentiles. Utilizing the Mann-Whitney U-test, the only significantly different pairwise comparison was that comparing AD subjects with and without LBs (p = 0.002).

