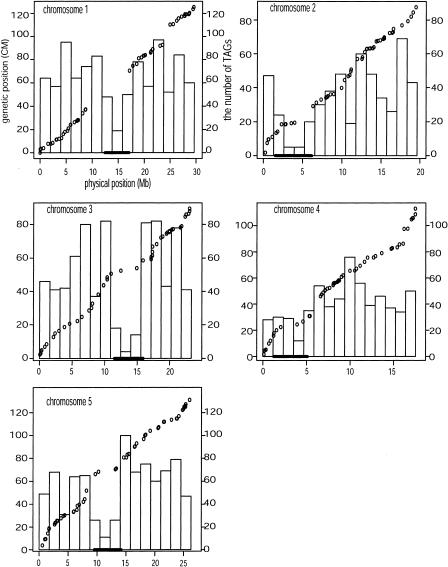
Figure 1.
Genetic and physical maps of all chromosomes and the distribution of TAGs with respect to the maps. For each chromosome, circles represent the genetic and physical position of markers, the histogram represents the number of TAG genes in the region, and the bar represents the centromeric region.

