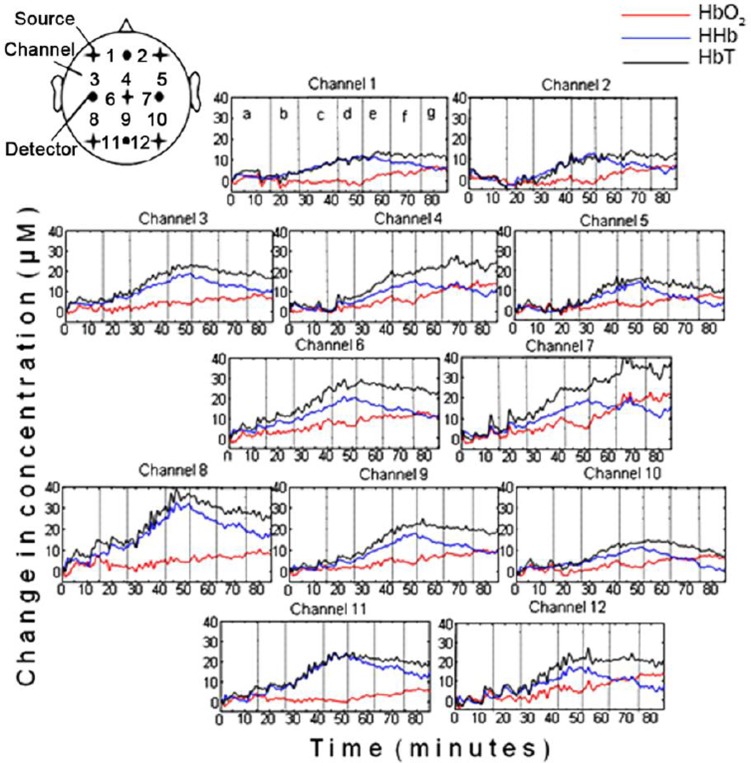
Fig. 1. HbO2, HHb and HbT concentration changes from 12 channels during ECMO circuit flow changes.
Each vertical line in the figures denotes where the ECMO circuit flow change occurred as annotated on channel 1 [a=baseline (100% flow), b=90% flow, c=80% flow, d=70% flow, e=80% flow, f=90% flow, g=100% flow].

