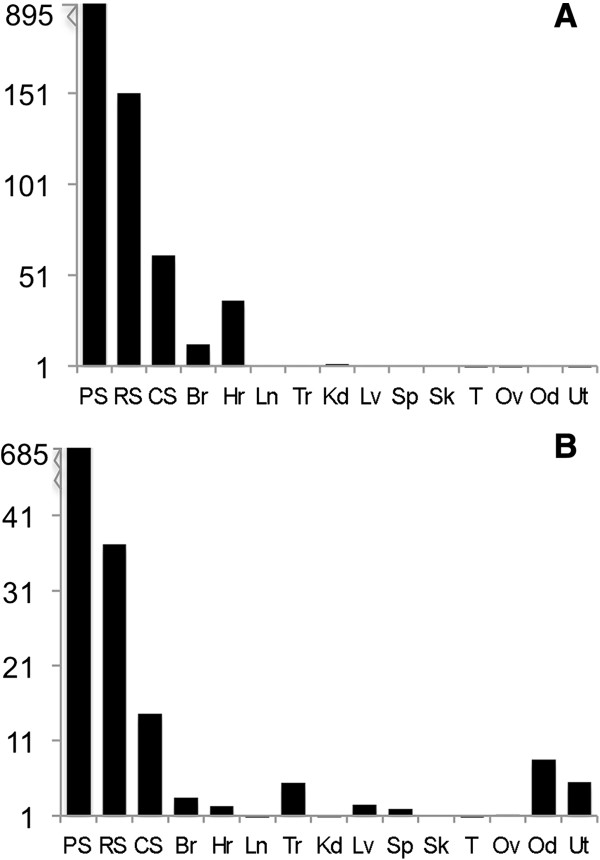
Figure 4.

Quantitative RT-PCR of Mfn2 (A) and Mns1 (B) in somatic and reproductive tissues. The expression level was determined as the fold-increase over baseline in mouse skeletal muscle. Gapdh and ribosomal protein S16 were used as expression control genes. Mfn2 and Mns1 were highly expressed in spermatogenic cells, decreasing from pachytene spermatocytes to condensing spermatids. Br: brain, Hr: heart, Ln: lung, Tr: trachea, Kd: kidney, Lv: liver, Sp: spleen, Sk: skeletal muscle, T: testis, Ov: ovary, Od: oviduct, Ut: uterus, PS: pachytene spermatocytes, RS: round spermatids, CS: condensing spermatids. Numbers on the ordinate represent fold-increase over baseline (mouse skeletal muscle).
