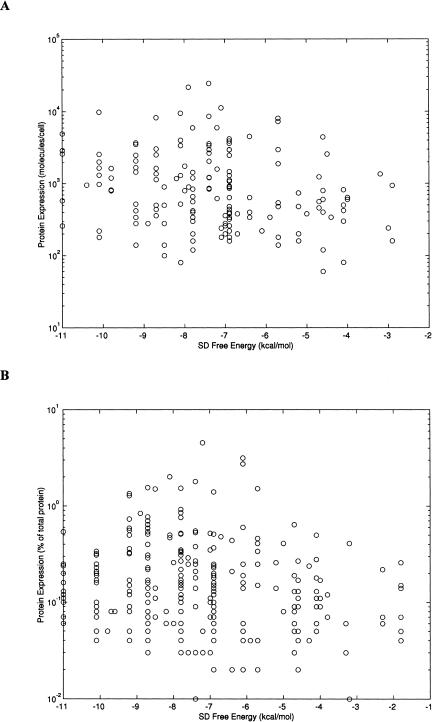
Figure 2.
Shine-Dalgarno (SD) free energy values versus protein abundance. The quantitative measure of the SD mRNA sequence is the free energy gain upon its base-pairing with the 16S rRNA. Scatter plots of the free energy values versus protein abundance are shown for 163 highly expressed E. coli proteins (A) and for 297 highly expressed H. influenzae proteins (B). Protein abundance is shown on a log scale.

