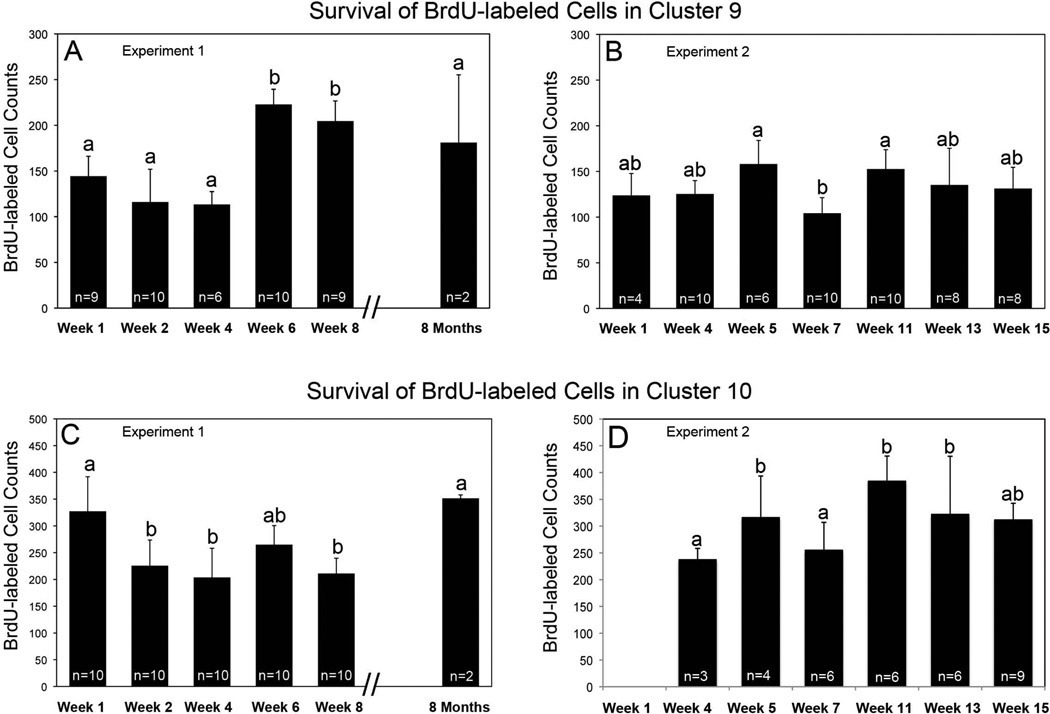
Figure 3.
Histograms of mean numbers of BrdU-labeled cells counted in cluster 9 in Experiment 1 (A: F=28.82, df=5, p=0.0001, One-way ANOVA) and Experiment 2 (B: F=4.75, df=6, p=0.0007), and in cluster 10 in Experiment 1 (C:, F=11.08, df=5, p=0.0001) and 2 (D: F=9.54, df=5, p=0.0001). One-way ANOVA analysis was followed by Tukey multiple comparison test. Statistical similarity is indicated by the same letters. These histograms provide evidence for a period of cell death in cluster 10 between weeks 1 and 2 after BrdU labeling (C), as well as delayed divisions and increased cell numbers at weeks 5–6, and 11 in both clusters 9 (A, B) and 10 (C, D). Cell death following these late divisions is also indicated in B and D between weeks 5 and 7, and in C between weeks 6 and 8. The number of cells clusters (n) counted for each time point is indicated on the histogram.

