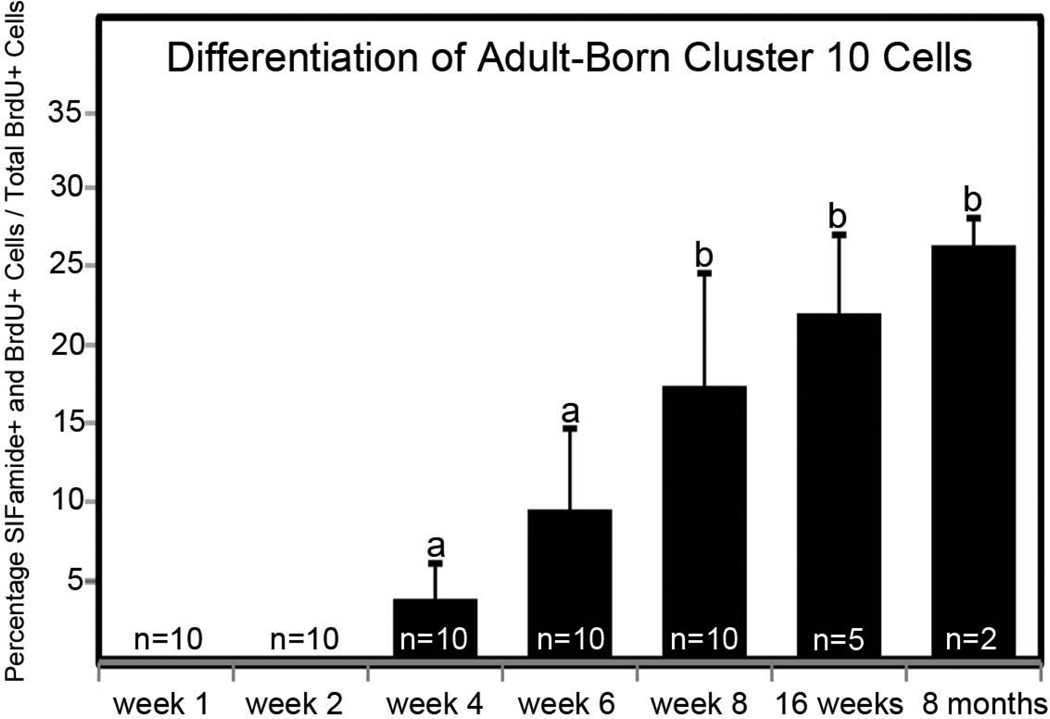
Figure 5.
Differentiation of adult-born cluster 10 neurons. Mean percentages (± standard deviations) of SIFamide and BrdU double-labeled neurons to total BrdU-labeled neurons in cluster 10 analyzed over the time course of Experiment 1. The “n” represents the number of cell clusters assessed for each time point. One-way ANOVA analysis (F = 17.920, df = 4, p < 0.001) followed by Tukey multiple comparison test revealed significant differences between groups a and b (p < 0.001).

