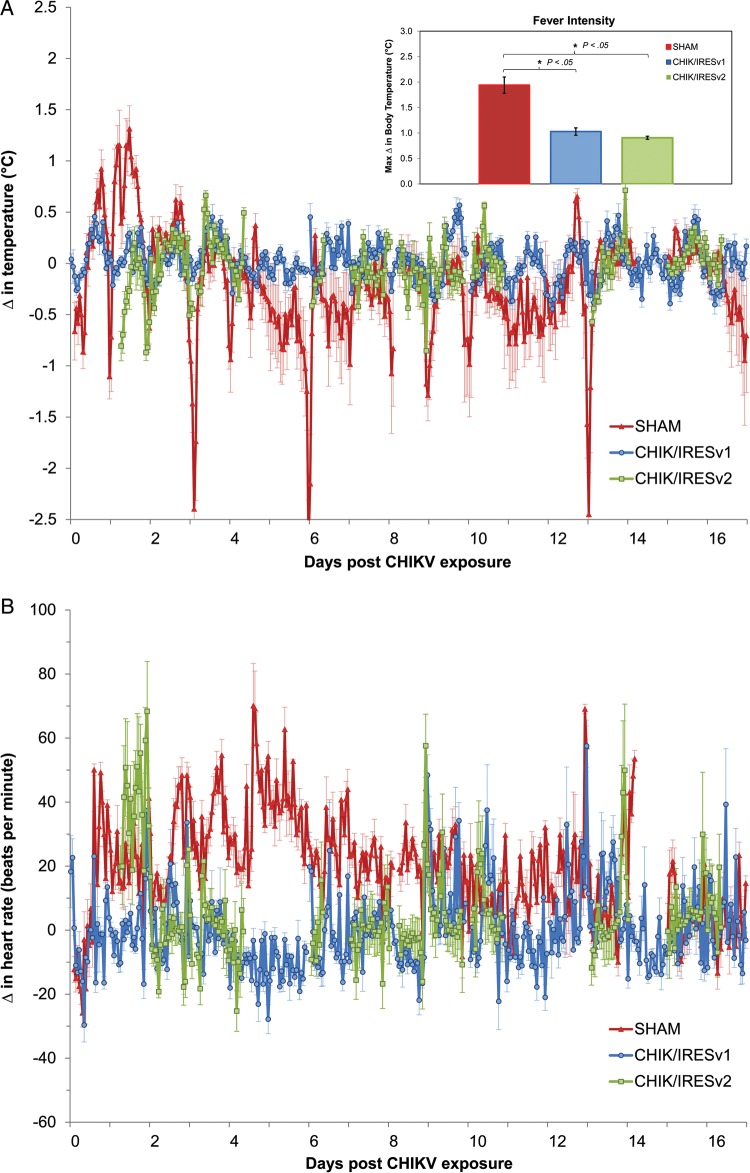
Figure 4.
Physiological responses of vaccinated cynomolgus macaques to CHIKV challenge. Changes (Δ) in body temperature (°C) (A) and heart rate (beats per minute) (B) from baseline following challenge with wild-type CHIKV strain La Reunion (CHIKV-LR), displayed as hour means (mean ± SD) for animals vaccinated with saline (red), CHIKV/IRESv1 (blue), and CHIKV/IRESv2 (green). Gaps in the data are a result of transient loss of signal in the telemetry system. The extended gaps in the CHIKV/IRESv2 group data, in particular, are a result of an intermittent malfunction of the acquisition software. The bar graph inset in (A) details the results of fever intensity analysis among groups. Significant changes among vaccination groups were compared statistically (Kruskal-Wallis). Further post hoc analysis was performed (Tukey HSD) to highlight differences between the SHAM vaccinated group and the 2 vaccines cohorts. Bars indicate standard deviations and significant results with P < .05 are indicated on the bar graph inset. Abbreviations: CHIKV, chikungunya virus; IRES, internal ribosome entry site; SD, standard deviation.

