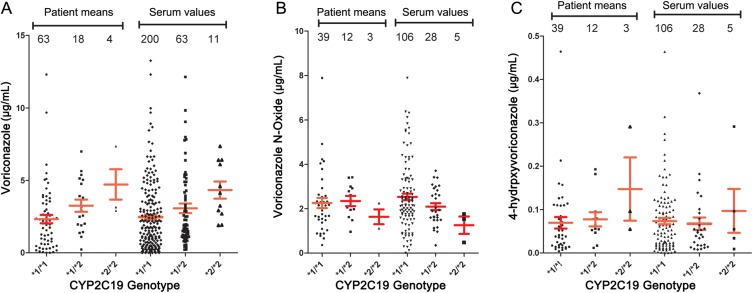
Figure 3.

Serum concentrations of (A) voriconazole, (B) voriconazole N-oxide, and (C) 4-hydroxyvoriconazole by CYP2C19 *1/*1, *1/*2, and *2/*2 genotypes, tallied by average of all sera and by patient averages. Means and standard errors are shown. Numbers of values in each genotype are shown.
