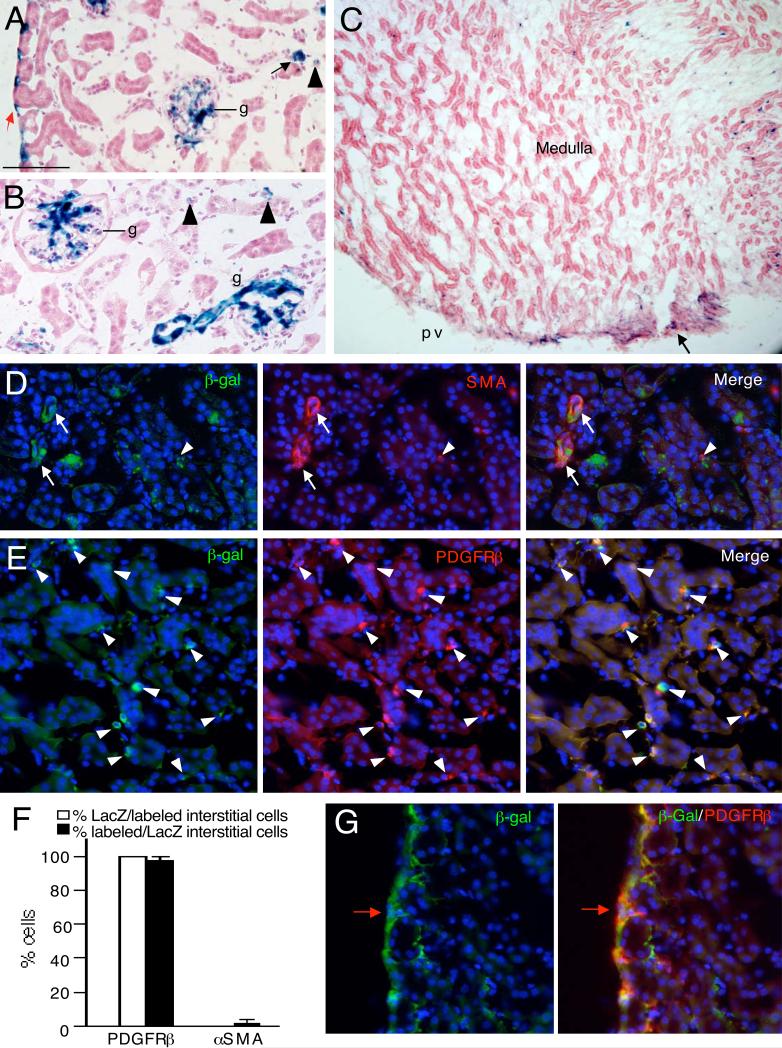
Fig. 3. Characterization of Tbx18+ cells in the adult kidney of Tbx18Cre/+;R26RLacZ/+ mice.
(A,B) X-gal stained kidney sections showing LacZ+ cells in renal capsule (red arrow), glomeruli (g), vessels (black arrows), interstitium (arrowheads). (C) X-gal stained kidney section showing LacZ+ cells in the medullary region and renal papilla (arrow). (D) Kidney sections costained with antiβgal and -μSMA antibodies showing perivascular cells double positive for αSMA and β-gal (arrows). Arrowhead points to double positive cell in interstitium. (E) Kidneys sections co-stained with antiβgal and -PDGFRβ showing double positive cells in the interstitium (arrowheads). (F) Graph showing quantification of the proportion of PDGFRβ+ or μSMA + interstitial cells co-expressing β-gal and the proportion of β-gal+ interstitial cells co-expressing PDGFRβ. (G) Kidney sections co-stained with antiβgal and -PDGFRβ showing double positive cells in the renal capsule (red arrow). Scale bar: 100 μm for A,B, 200 μm for C and 50 μm for D,E,G.

