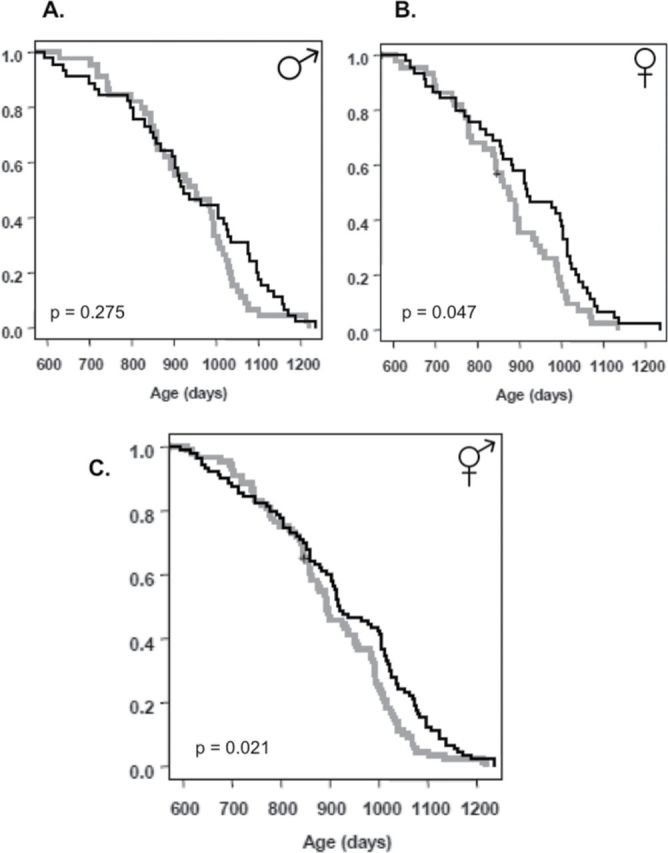
Figure 5.

Survival. (A) Male control (n = 44) control and rapamycin-fed (n = 45), (B) Female control (n = 43) and rapamycin-fed (n = 45), and (C) Both sexes combined control (n = 87) and rapamycin fed (n = 90). Controls are shown in grey and rapamycin-fed mice in black. The survival curves were compared using the Cox-Mantel log-rank test, the p-values for males, females, and the sexes combined are shown; sex • treatment interaction was not significant (p = .532). A more powerful Cox Proportional Hazards Model found a significant effect of rapamycin feeding (p = .01) and sex (p = .02). See text for details.
