
Figure 1.
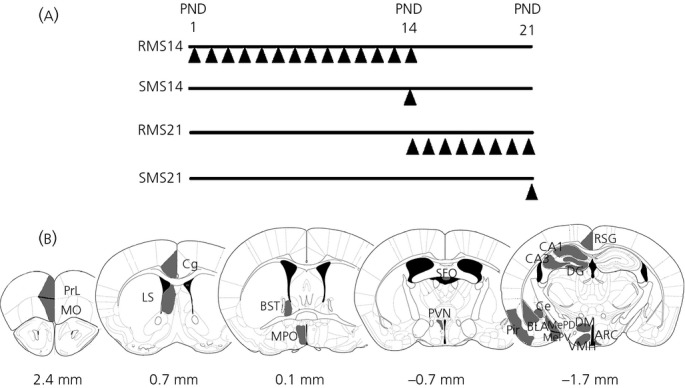
Graphical representation of maternal separation (MS) procedures and brain regions analysed for c-Fos expression. (a) Repeated MS (RMS) was performed from postnatal day (PND) 1 to 14 (RMS14) or PND14 to 21 (RMS21). Acute/single time MS (SMS) was performed on PND14 (SMS14) or PND21 (SMS21). A triangle (▴) indicates a single trial of MS. (b) Shaded regions were subjected to c-Fos expression analysis. Values under the schematic diagrams indicate the distance from the bregma line. For abbreviations, see Table 1.