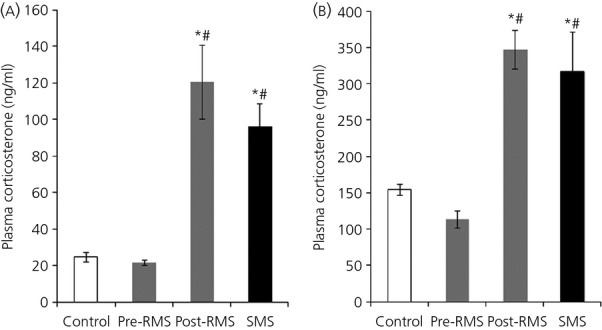
Figure 2.

Plasma corticosterone levels of repeated MS (RMS) and acute/single time MS (SMS) mice on postnatal day (PND) 14 and PND21. The graphs show plasma corticosterone concentrations on PND14 (a) and PND21 (b) (n = 5-9 for each group). Blood samples were collected before (pre-RMS) and after (post-RMS) the final separation for RMS mice and after separation for SMS mice. *P < 0.05 versus control; #P < 0.05 versus Pre-RMS. For abbreviations, see Table 1.
